New Methods to Help Achieve Net-Zero Carbon Emissions for the Building Industries of Taiwan
Advertisement
Introduction
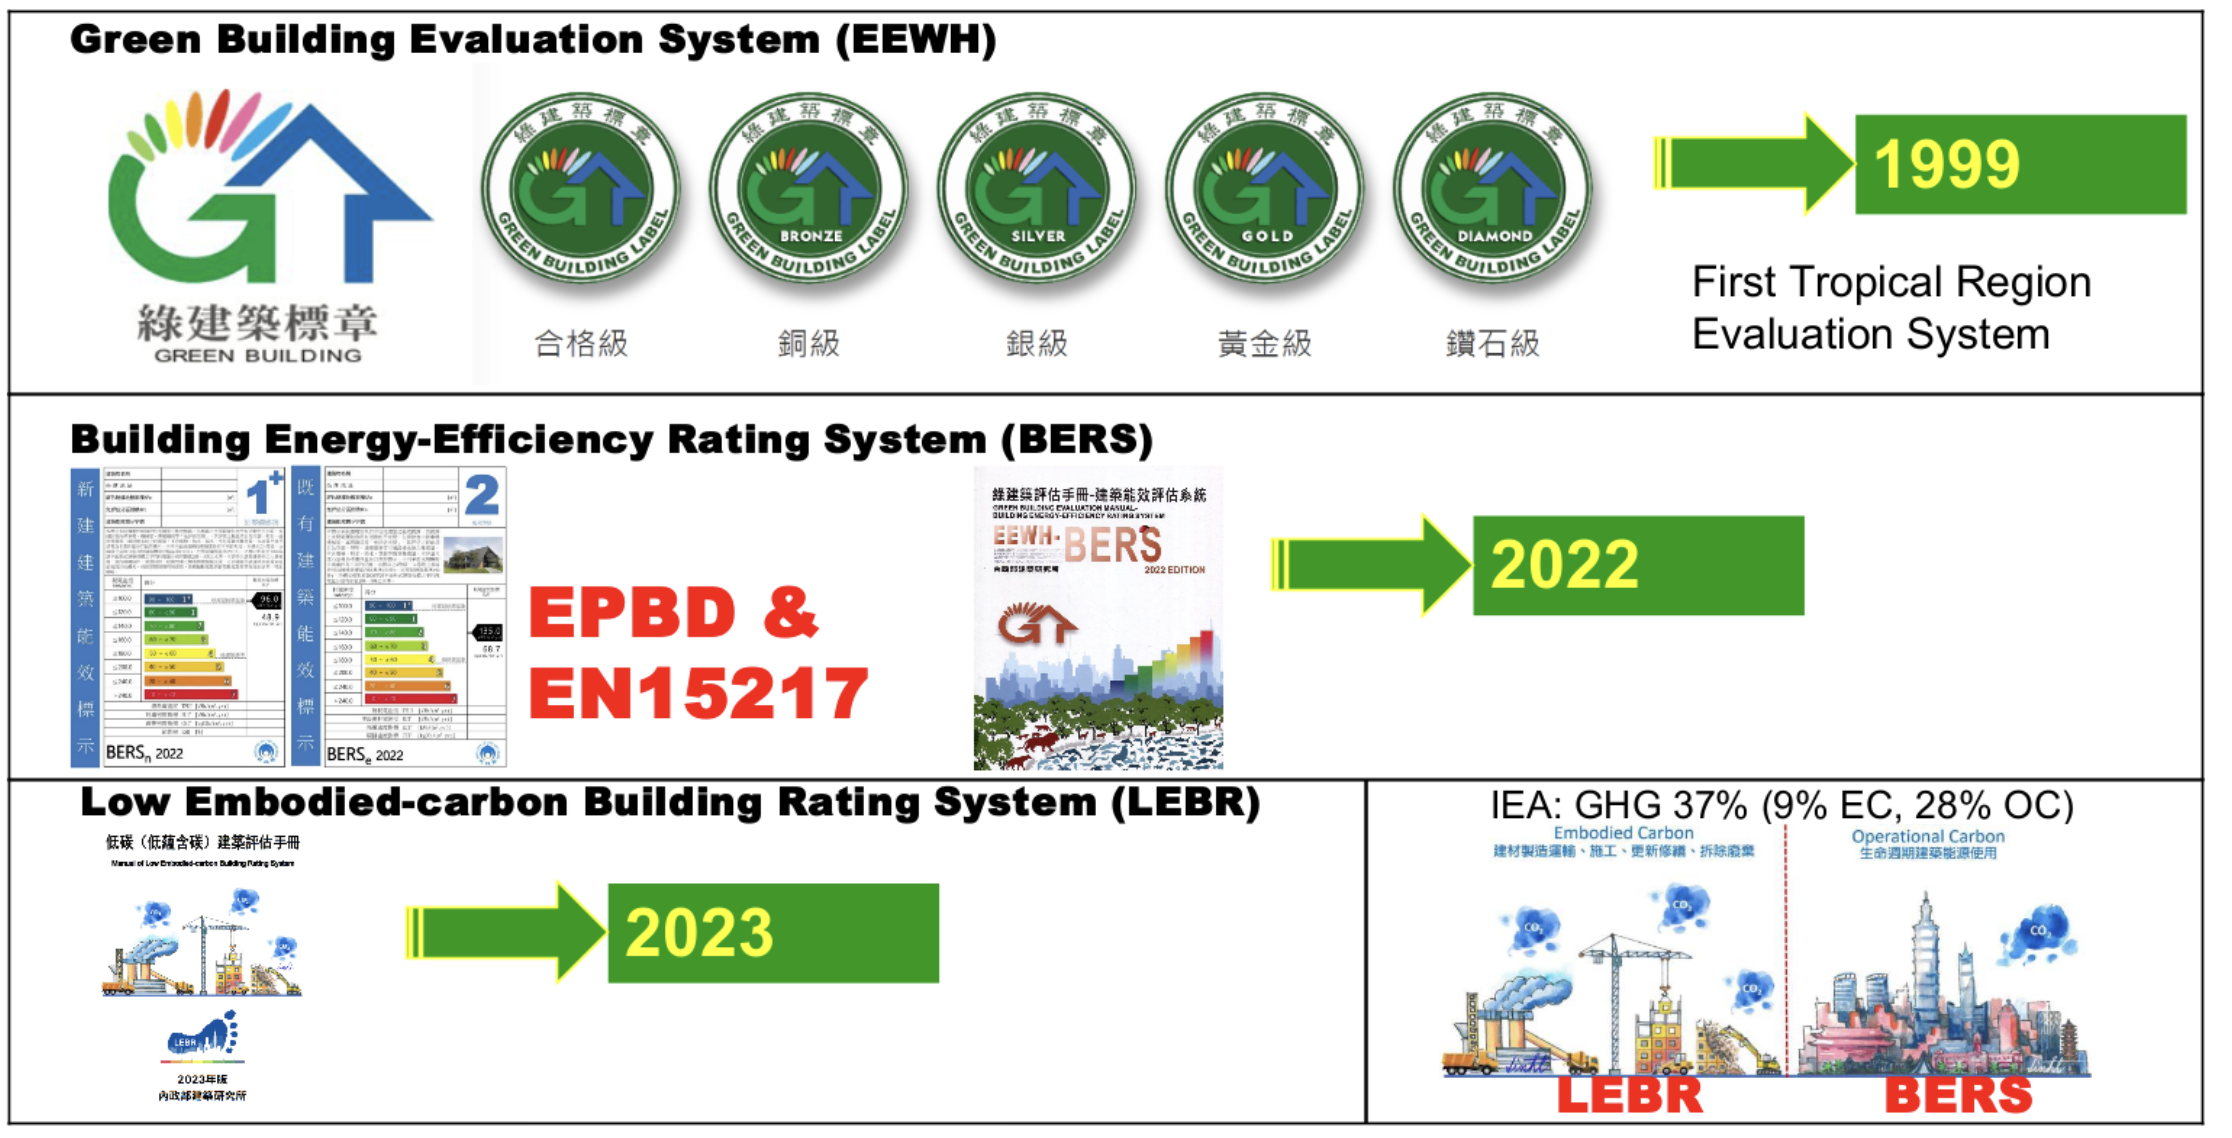
In 1999, the Architecture and Building Research Institute (ABRI) of the Ministry of Interior released Taiwan's green building evaluation system, which was the fourth green building evaluation system in the world and the first to consider the climatic conditions of subtropical and tropical regions. After more than 20 years of implementation, whether in public sector buildings or private construction projects, it has greatly improved the construction industry's Environmental ecology, Energy-saving, Waste reduction, and Health issues (EEWH).
In 2022, the Architecture and Building Research Institute (ABRI) proposed a Building Energy-Efficiency Rating System (BERS). The following year, a Low Embodied-carbon Building Rating System (LEBR) was proposed. Both of them evaluate all the carbon emissions from the construction industry in one fell swoop. BERS and LEBR can be said to be the two keys for Taiwan to move towards net-zero buildings. Taiwan has made a lot of efforts to achieve net-zero carbon emissions. See Figure 1.
Figure 1. The evolution history chat to net-zero carbon emissions of Taiwan. (Drawn by Prof. Hsien-Te Lin, the author of EEWH, BERS & LEBR)
As shown in Figure 1, In 2021, the International Energy Agency published its landmark report, Net Zero by 2050: A Roadmap for the Global Energy Sector. It pointed out that the global construction sector’s greenhouse gas emissions accounted for 37 percent of total emissions, of which 28 percent came from energy use of buildings and 9 percent resulted from the manufacturing, transportation, and construction of building materials. In other words, 28 percent is Operational Carbon (OC) and 9 percent is Embodied Carbon (EC). This is the net zero building life cycle initiative revealed by the International Energy Agency. In Taiwan, we use the Building Energy-efficiency Rating System (BERS) to evaluate the operational carbon of the building, and the Low Embodied-carbon Building Rating (LEBR) System to evaluate the embodied carbon of the building.
Disclosure based on carbon footprint has always been able to only show the results of carbon emissions, and cannot achieve the resource reduction from the source. We established an assessment method for carbon emissions in the construction industry. People can obtain assessment and certification through the process of planning, design, and completion through the carbon emission database that meets the PAS2050 standard. PAS 2050 was introduced in 2008 (revised in 2011) with the aim of providing a consistent internationally applicable method for quantifying product carbon footprints. It provides a carbon footprint assessment methodology and guidance for assessing greenhouse gas emissions throughout a product’s life cycle. It covers multiple stages such as raw material production, processing and manufacturing, transportation, use, and final disposal. The standard provides guidance on carbon footprint assessment, guidance on scoping, recommendations on data collection and calculation methods, and requirements for carbon footprint reporting.
Advertisement
Figure 2.1 The Boundaries of the embodied carbon. (EN15978)
Figure 2.2 The Boundaries of the embodied carbon. Converted from EN15978.
Using these assessment methods, we set the calculation theories which combine landscaping hard work, embodied carbon in the materials, and construction-related carbon based on the life cycle assessment (LCA) concept and established an embodied carbon database within the system boundary of "cradle to handover", see figure 2. Although landscaping works in its broad definition may encompass mega-landscapes such as rivers, bridges, coasts, and soil and water conservation, we limited its scope to only architectural landscaping works that neither requires mega-sized construction machinery nor significantly alter the topography and are close to people’s everyday life, i.e., landscaping on urban and rural flat sites including gardens in building projects, neighborhood parks, exposition parks, and private gardens. The works involved in this type of landscaping may be classified into hard landscaping facilities such as roadways, paving, drainage, retaining walls, ponds, and fencing, and soft landscaping and planting such as trees, shrubs, lawns, hedges, and climbers.
Calculating the Carbon Footprint of Landscape Machinery
The analytical theories on construction machinery carbon for landscaping components were divided into 5 steps as outlined below, see Table 1:
1. Establish the energy consumption rate of machinery. The energy consumption rate of machinery is the standard energy consumed by every type of machinery per unit of time.
2. Workload of machinery per unit time. The workload of machinery per unit time is its work efficiency, with the unit being the workload per hour, m3/hr, or T/hr. Work efficiency may vary widely depending on the soil condition, work environment, work cycle, slope grade, transport distance, etc., but since the landscaping works are limited to urban and rural flat sites here, the geological and geographical conditions are relatively straightforward and may be generally standardized.
3. Calculation of standard emission intensity for machinery. The emission intensity standard of each machine is calculated by multiplying the above energy consumption rate, unit time workload, and carbon coefficient for diesel. The unit is kgCO2e/ m3 or kgCO2e/T.
4. Establishing standard work procedures for machinery used in landscaping components. The key to analyzing the construction carbon for a landscaping component is to correctly understand the construction procedure for the machinery involved and add up the carbon for each step.
5. Calculating construction carbon based on workload. The workload for each machine is first calculated based on the above procedure and the construction drawings; it is then multiplied by the corresponding emission intensity standard. The sum of all machines is the construction carbon for the whole project.
Advertisement
Table 1. Standard carbon emission from construction using common machinery in landscaping
Calculating Embodied Carbon in Landscaping
The emission intensity standard for the construction of various landscaping components may be established according to the theories on construction carbon outlined above, and the cradle-to-site carbon for the materials may be calculated based on the construction drawings. Adding both together will yield the "cradle to handover" L-LCC database referred to herein.
To date, the embodied carbon databases for most landscape infrastructure here in Taiwan have been established for several components, including road paving, walkway/plaza/stairway, boardwalk/platform/footbridge, soil drainage, soil retention, and water bodies.
Applying the Carbon Databases to a Landscape
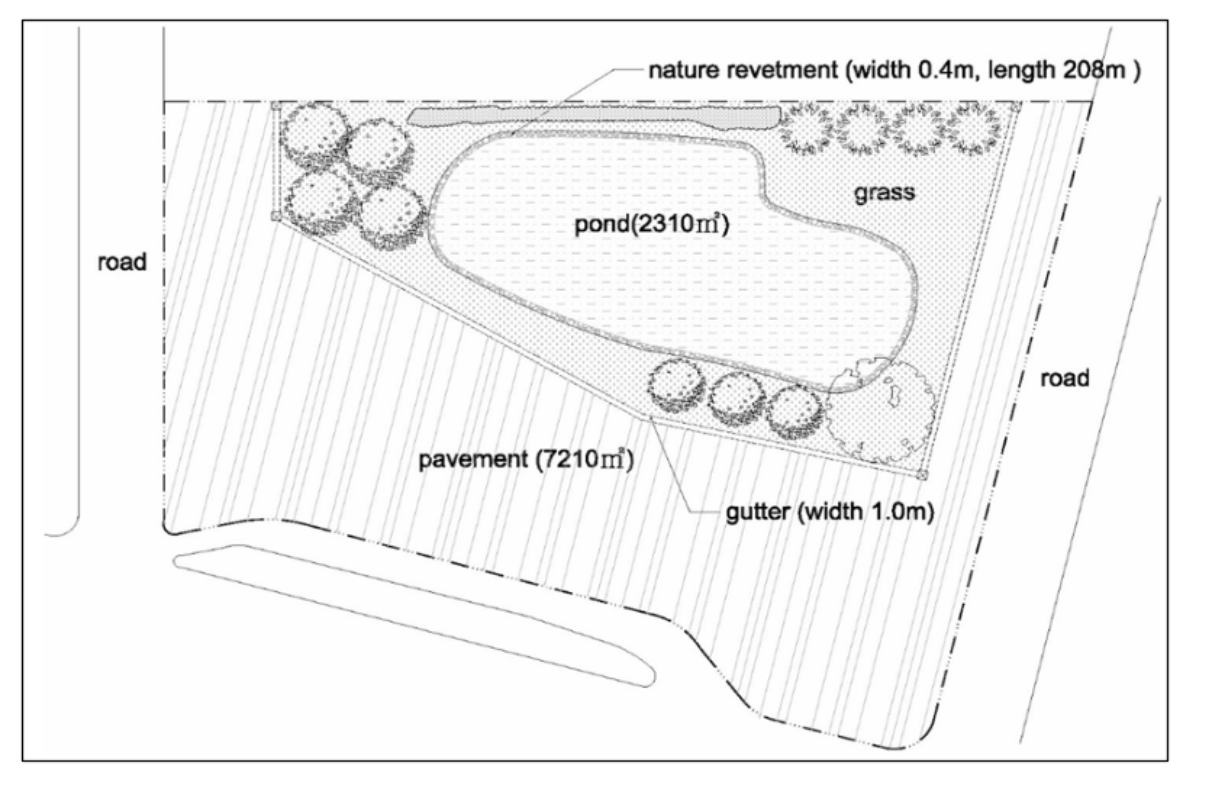
Figure 3. An urban plaza as the illustration of the practice application for carbon reduction design.
Let's use an urban plaza (see Figure 3) as an example to illustrate the practical application on carbon emissions reduction of the L-LCC database. This case used traditional construction methods as follows: Dry cement-brick sidewalk, exposed trench: site-cast RC, and RC bank. According to the site plan and the carbon emission data shown in Table 2, the total carbon emission from the cradle to completion of this construction is calculated to be 447,771.83 (kgCO2e). However, if this case used natural construction methods: Dry masonry sidewalk, exposed trench: wet-laid stone, and wet masonry bank, the total carbon emissions will be reduced to 177,908.36 (kgCO2e) or 60.3 percent. It shows that the L-LCC database has included the complex calculation of construction carbon emissions in the database of the landscape components. Therefore, we can evaluate the carbon emissions from the design site plan to the completion of construction which under the EN15978 standard carbon footprint assessment from cradle to handover and make an alternative plan of carbon reduction design.
Table 2. The comparison of the traditional and natural construction methods on carbon emissions.
Advertisement
The L-LCC database herein is established using sums from analyzing standard construction drawings, construction machinery procedures, and construction quantities. This data may be liberally applied to construction items similar to these construction drawings. With work items deviating far from these standard drawings, however, one may perform the calculations in a similar way to the above procedure based on applicable drawings.
The analysis above illustrates that although large construction machinery appears to consume significant energy in hard landscaping works, the associated ratio in even landscaped roads requiring extensive machinery is still only 1 to 4 percent of that of the construction materials, thanks to the high efficiency of the machinery. The ratio becomes lower than 1.0 percent for labor-intensive landscaping works like ponds, shore protection, boardwalks, and gardens. Nevertheless, this low-ratio and hard-to-analyze construction carbon is a mandatory assessment item in EN15978. This bottleneck to the development of landscaping LCA is now resolved through the incorporation of construction machinery carbon in this L-LCC system.
In keeping with the international trend of sustainable industry development, it is inevitable to apply carbon LCA to landscaping, but the greatest barrier in current research for landscaping carbon LCA lies in the lack of a reliable and user-friendly carbon database specific to landscaping. However, we have overcome this obstacle and established a carbon database L-LCC based on the cradle-to-handover system boundary of EN15978. This database is the first to incorporate construction machinery carbon into a cradle-to-handover carbon database. It serves to resolve the problem of carbon analysis for construction machinery, which accounts for a low ratio and yet is onerous to execute. In particular, L-LCC provides landscaping embodied carbon data at the component level, which contributes vastly to LCA research and practice toward the goal of sustainability in landscaping.
Conclusion
We all know the best way to net zero carbon is to not build at all. But this is impossible. So how to design and build while minimizing our carbon footprint is very important. The establishment of Taiwan's Life Cycle Carbon Database of Landscape (L-LLC) provides planners and designers with a way to review how to design and reduce carbon emissions. We look forward to the landscape and green infrastructure industries keeping pace with the world and moving towards a net-zero carbon emission future.
Advertisement
Yi-Jiung Lin, Vice President, Taiwan Green Roof & Green Wall Association, holds a master's degree in landscape architecture and a doctorate in architecture. She currently serves as the vice president of the Taiwan Green Roofs and Green Walls Association and a board member of the World Green Infrastructure Network. After retiring from teaching at the university, she is now concerned about the issue of climate change, actively engages in ecological landscapes and low-carbon green buildings, and often gives lectures in various communities on disaster prevention and health support to local people for sustainable living.
Email: eugenialin399@gmail.com
Sources
Hsien-Te Lin, Yi-Jiung Lin, Environment, Development and Sustainability, 2021 https://doi.org/10.1007/s10668-021-01640-5
Architecture and Building Research Institute (ABRI), the Ministry of Interior of Taiwan, Hsien-Te Lin, Manual of Low Embodied-carbon Building Rating System, 2023
Architecture and Building Research Institute (ABRI), the Ministry of Interior of Taiwan, Hsien-Te Lin, Manual of Building Energy-Efficiency Rating System, 2024


